
I am the fastest mile sprinter in the world. According to my own data, and the fact that I've never raced anyone else in a mile sprint, I am the fastest... Until you time me. Then I might not be the slowest, but I am certainly not the fastest. This is how we like to think of utilizing SOLIDWORKS. It's not that your current system is the worst (trust us, it's probably not!), but it's certainly not the best. If you want to be efficient and know where you rank in terms of your product data management system, you have to compare it to others, or at least take inventory of what you're capable of.
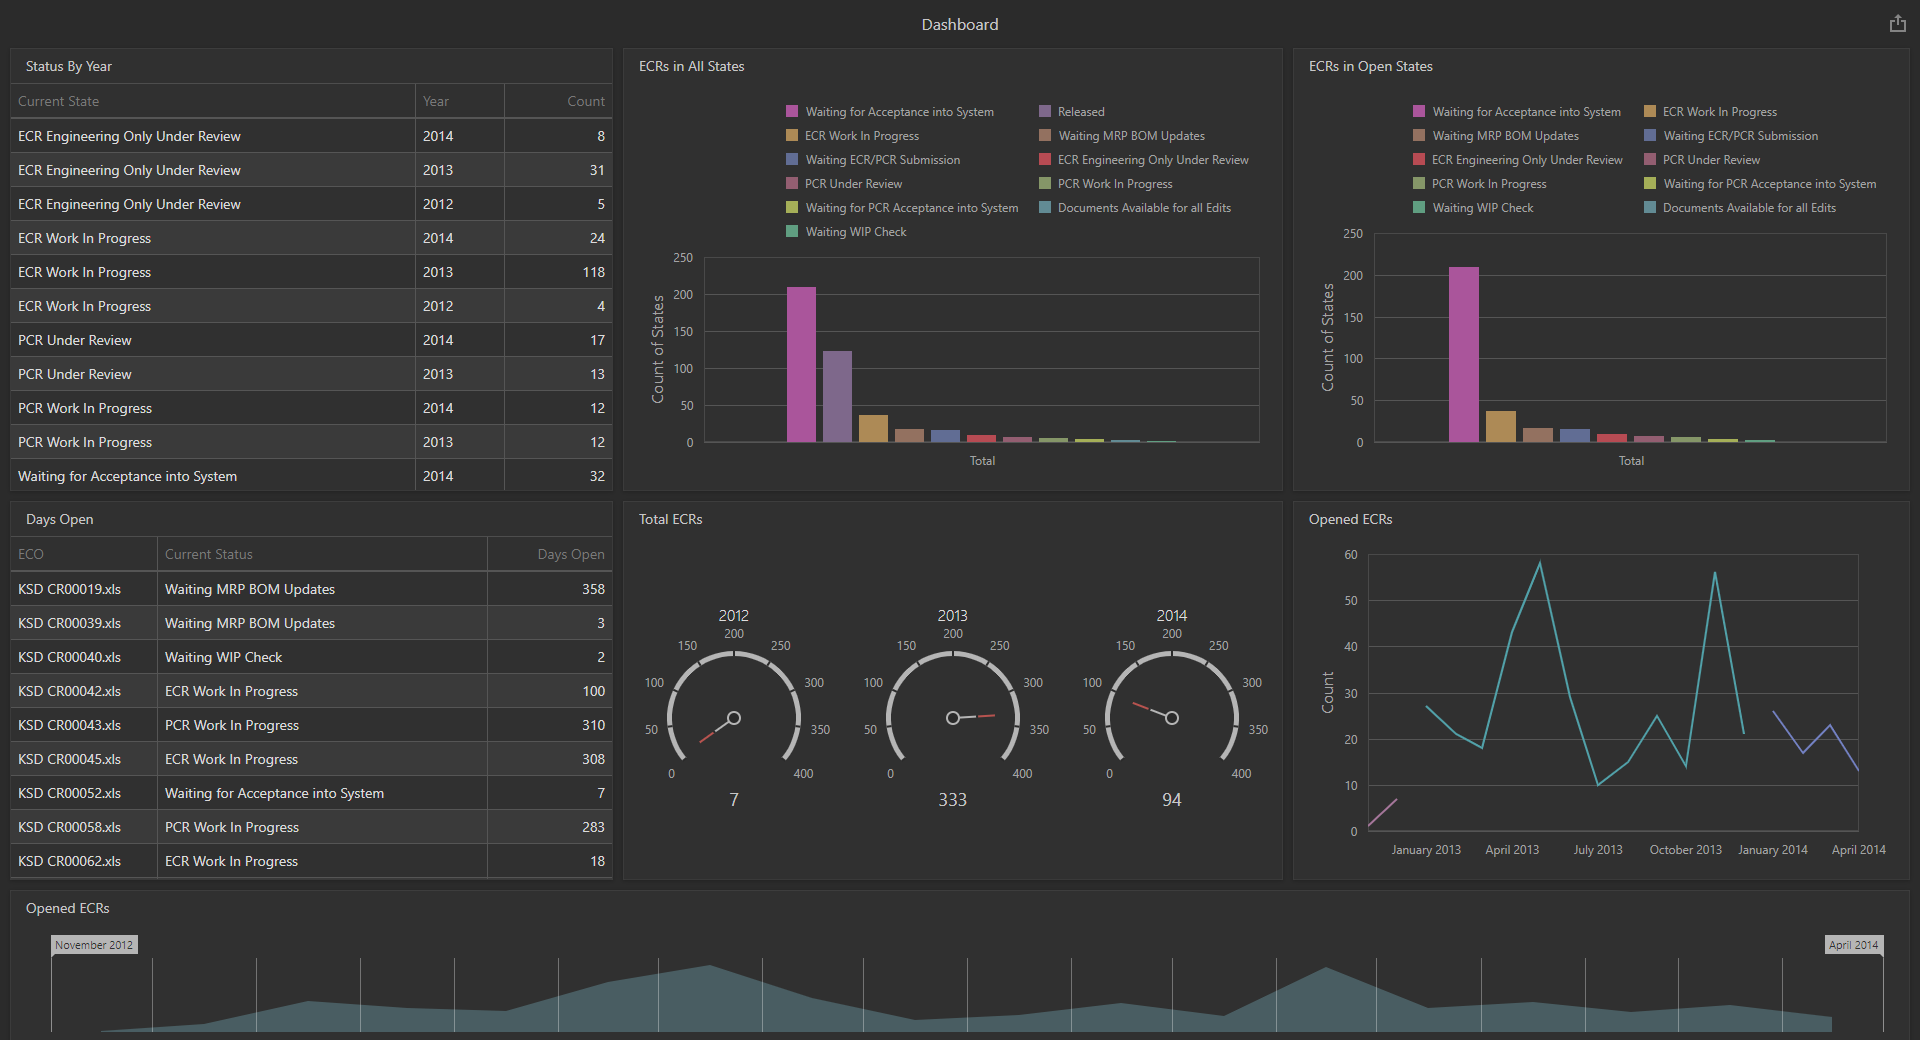
This is where dashboards come into play. If you're a visual person like I am, this tool was made with you in mind. It takes data from your projects, tasks, and engineering and development progress, and puts them all in front of you in graphs and charts. It's incredibly easy to see just how much you've gotten done when you use dashboards. Here's where timing your mile is made easy. When a manager wants to know what phase a project is in, how many projects are "complete" or "in progress," they can get an immediate answer without an "uhhh…" and it's in an easy to read, visually appealing progress chart! You can even break progress down by milestones within a project.
It uses your data from your vault, and it never leaves your server. It's simply a tool we designed to plug into your SOLIDWORKS PDM, and we designed it because we're all visual learners here and it's a tool we wanted personally. We've found that it fits the needs and wants of our clients well, which makes sense because we also find that engineers and designers tend to be like-minded people. It's private, secure, and it does all of the analytic leg work for you, no Excel required! 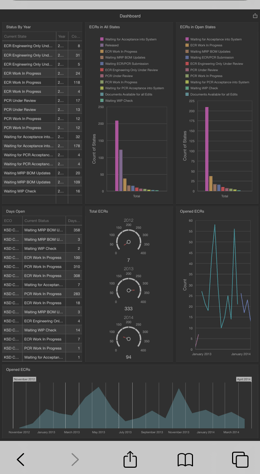
It can also show you a month-by-month bar chart of your firm's productivity. We will all cringe at our April stats (thanks, COVID), but if May is our best month yet, don't you want to know? The data that comes with utilizing your firms productivity with dashboards is powerful, and can help you keep your firm on track, and identify problems early on.
Dashboards can also help you keep scheduling smooth, avoid overwhelming people, and keep tasks organized. These seem like basic things, but they're essential to a smooth running workforce. Schedule visibility is imperative, especially with bigger teams and remote work. It also displays work load levels, so you can know when employees are overwhelmed, or if someone can handle taking on a new task. Productivity is sorted by employee, with a report showing how many tasks each worker finished.
Dashboards aren't just to admire your stellar workforce, it's also an excellent tool to shed some light on your weaknesses. The graphs can show you exactly where things might be bottlenecking, meaning you can identify and solve productivity problems more efficiently, long before they ruin your deadline.
Dashboards, in my opinion, are one of the most understated and valuable tools that we offer. It's a great visual tool that will accurately and quickly tell you what your progress is, help you troubleshoot bottlenecks, and it's nice to look at. It's desktop and mobile friendly, so being on the go is not a problem, making it perfect for design, production, and sales teams!
If you're interested in learning more about dashboards, we're happy to schedule a free meeting with you to see if it's the right tool for your firm.