
Could you imagine driving a car without a dashboard? No speedometer, no gas gauge, who knows what your engine temp is and could you even guess your oil pressure?! You'd have no idea something was wrong until it was far too late.
So.. why run your company without one? The metrics a dashboard provides can be life saving. Okay, that might be dramatic, but they can certainly be cash, time, and deadline saving! Dashboards are a tool to visualize performance, focus resources, and make better decisions because what you get out of PDM is just as important as what you put in.
SOLIDWORKS PDM is built on SQL server. If that sentence is like reading a foreign language to you, here's what it means: your data is mineable. "Data mining" can be a scary term if you don't know what it entails, and while it's a little more ominous when it comes to your social media data being mined, data mining in this context is simply using the existing data within your PDM system to gain more insight and make better predictions about the future using your unique data set.
There are two essential components needed to build dashboards:
1. A database you can query
2. A dashboard interface
The SQL database is built on SQL structured query language, and the tables are self explanatory. However, joining the tables together in a query requires a bit more knowledge. If you need help learning how to query, shoot us an email or schedule a meeting, we're happy to help!
Once you query the data into a dataset, getting the data into a graph, chart, or report is pretty easy. Most tools like Tableau, Periscope, .Net, DevExpress, and others have a graphical user interface full of the latest cool chart objects. If you like things laid out in front of you, color-coded, and easy to see, this is for you.
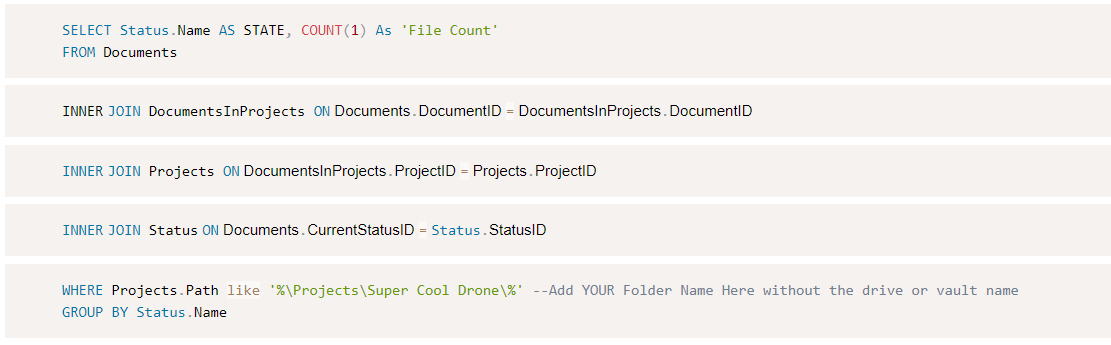
If you're just looking for somewhere to start, an easy first chart to create is one showing how many documents are in the "Work in Progress" state in PDM. Here's what the SQL query looks like:
Don't stop there though! Once you've tackled your first chart, you can move on to whatever other metrics you want to visualize. The possibilities feel endless. Here's a list of other metrics our customers commonly measure:
- Drawing release time to production
- Number of engineering change orders (ECO's)
- Cost per ECO
- Turnaround time per ECO
- Average time to release product to market
- Average cost to maintain per user
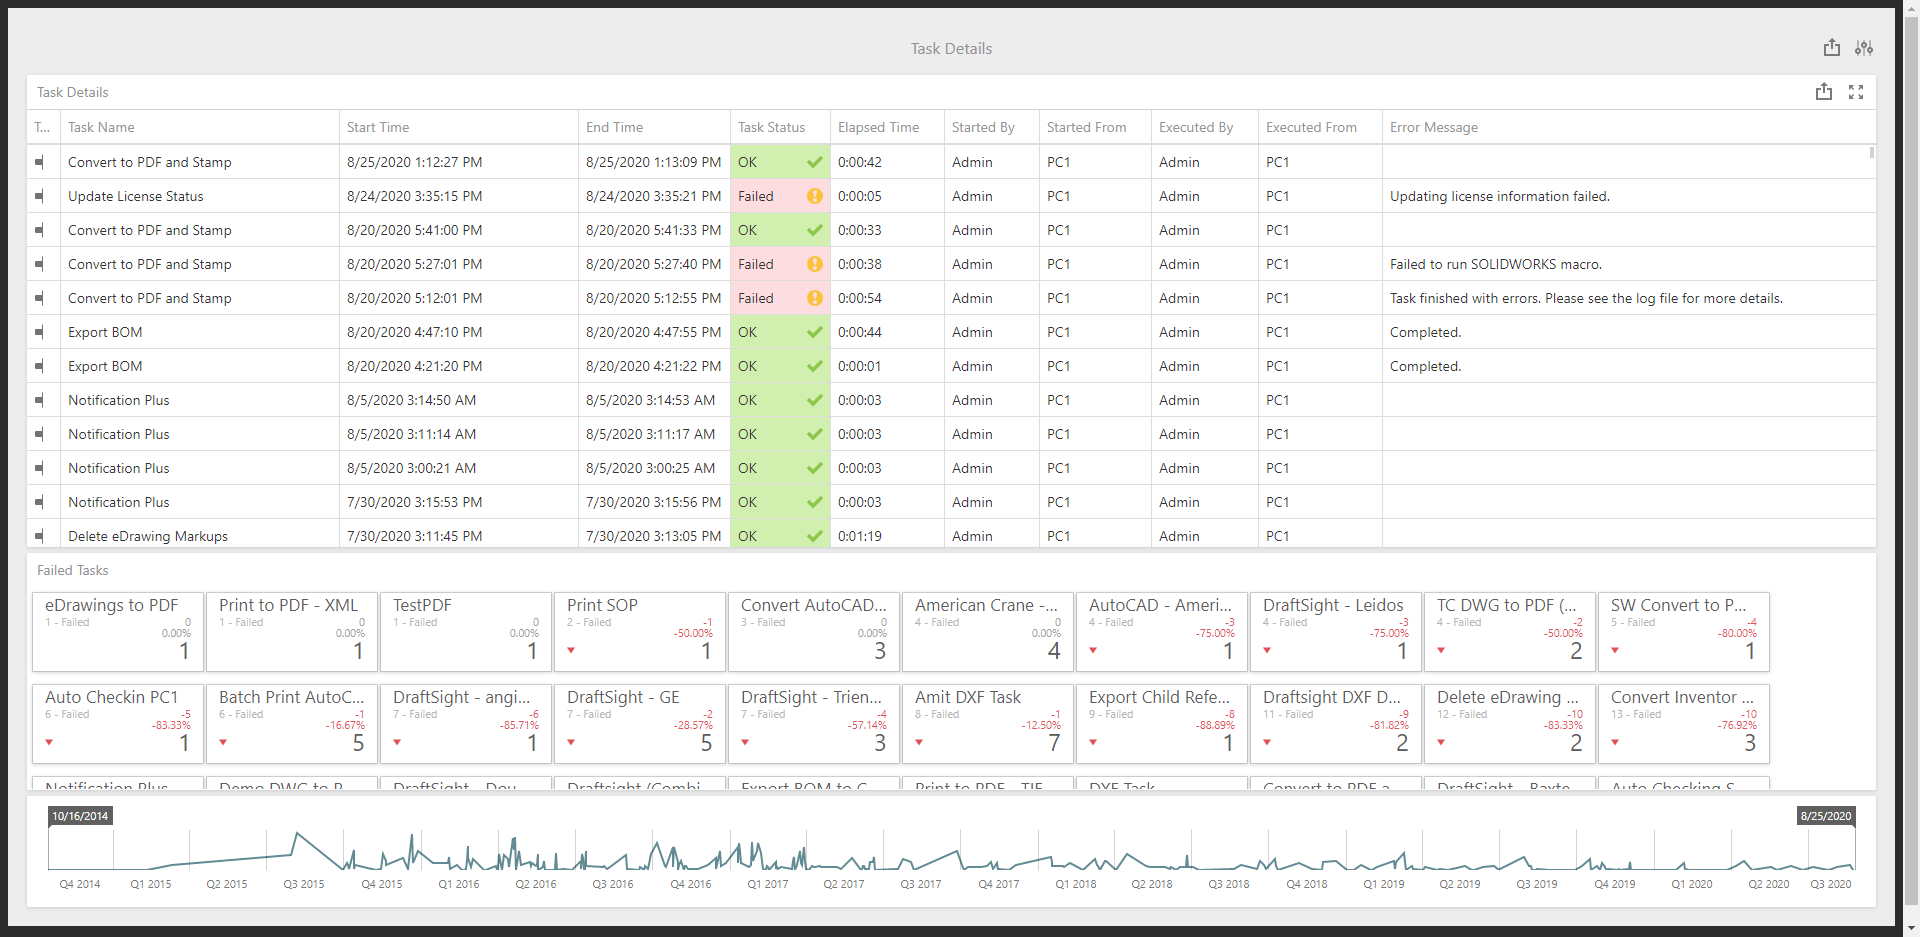
Here's some images of what a dashboard might look like:
.png?width=1920&name=image%20(1).png)
Once you get your bearings with these graphs, you can probably tackle just about anything. Each firm's needs will be different, especially depending on what they want to focus on with their metrics, whether that be cost, time, both, or neither. Metrics can make all the difference. They give you a starting point, something to compare to, and if you've never used them before, they can be overwhelming and eye opening to see just what is going on behind the scenes in your company.
The goal with dashboards is to discover the dollar values associated with efficiency, knowing real-time status, deliberately focusing resources, and on the more intricate side, potentially AI or predicting and avoiding failures before they happen.
It all boils down to time and money. We could all use a little more of both! Knowing where your resources are going, and how much of them are going where.